[][]
[]Printing can have negative environmental impacts due to paper waste. We encourage you to explore eco-friendly alternatives. Bookmarking this page in your browser allows you to access it anytime.
[]This publication can also be converted to PDF, if you have a PDF printer installed on your computer. PDF printers function as virtual printers, enabling you to create digital copies of web pages and access the content offline.
[] { const buttonPrintPage = document.getElementById(‘estat-print-page-modal-toggle’); const cookieSkipModal = ‘skipModalBeforePrinting’; if (configuration.displayInPageHeader) { const headerElement = document.querySelector(‘.ecl-page-header .ecl-page-header__meta’) || document.querySelector(‘.ecl-page-header .ecl-page-header__title-container ‘) if (headerElement) { headerElement.prepend(buttonPrintPage); headerElement.classList.add(‘ecl-u-width-100’) } } buttonPrintPage.addEventListener(‘click’, () => { const skipModal = readCookie(cookieSkipModal); if (skipModal == ‘true’) { window.print(); } else { const eclModalElement = document.getElementById(‘estat-print-page-modal’); const eclModal = ECL.components.get(eclModalElement); eclModal.openModal(); } }); document.getElementById(‘print-submit’).addEventListener(‘click’, () => { const skipModal = document.getElementById(‘checkbox-skip-modal’).checked if (skipModal) { writeCookieWithMaxAgeValue(cookieSkipModal, ‘true’, 15768000); } else { deleteCookie(cookieSkipModal); } window.print(); }); });;}());]]>
[] Business profit share decreases to 39.1%
Overview
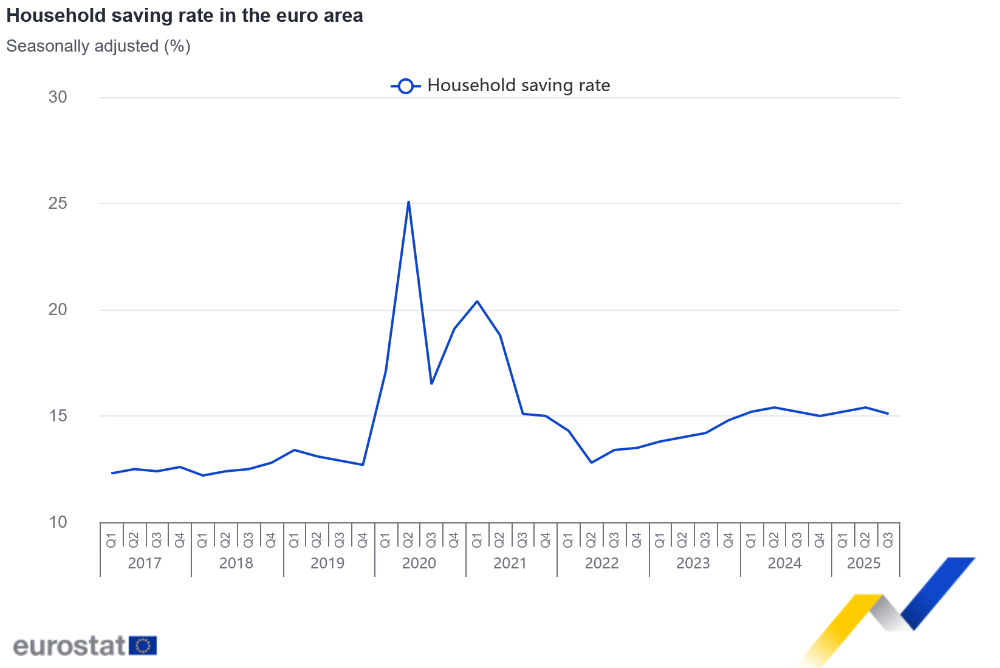
[]The household saving rate in the euro area decreased to 15.1% in the third quarter of 2025 (compared with 15.4% in the second quarter of 2025), which is explained by consumption increasing at a faster rate than gross disposable income (respectively +0.9% and +0.6%).
[]These data come from a first release of seasonally adjusted quarterly European sector accounts from Eurostat, the statistical office of the European Union.
[] At the same time, the household investment rate in the euro area remained stableat 9.0% in the third quarter of 2025, as gross fixed capital formation increased at substantially the same rate as gross disposable income (respectively +0.7% and +0.6%).
[] In the third quarter of 2025, the profit share of businesses (non-financial corporations) in the euro area slightly decreased from 39.2% to 39.1%, which is explained by the increase of business compensation of employees (wages and employers’ social contributions) plus taxes less subsidies on production, at a marginally higher rate than gross value added (both at +1.2% after rounding).
[] The business investment rate in the euro area slightly increased from 21.6% to 21.7% in the third quarter of 2025, as business gross fixed capital formation increased by 1.6%, at a faster pace than gross value added (+1.2%). The peaks in Q2 2017, Q2 2019, Q4 2019 and Q1 2020 are related to large imports of intellectual property products reflecting globalisation effects.
[]
Table
| []Key indicators and growth rates of selected transactions of the euro area
[]– seasonally adjusted – |
||||||||
|---|---|---|---|---|---|---|---|---|
| []2023 | []2024 | []2025 | ||||||
| []Q4 | []Q1 | []Q2 | []Q3 | []Q4 | []Q1 | []Q2 | []Q3 | |
| []14.8 | []15.2 | []15.4 | []15.2 | []15.0 | []15.2 | []15.4 | []15.1 | |
| []9.5 | []9.3 | []9.1 | []9.0 | []9.0 | []9.0 | []9.0 | []9.0 | |
| []1.4 | []1.6 | []0.7 | []0.9 | []0.6 | []0.9 | []0.9 | []0.6 | |
| []0.7 | []1.2 | []0.4 | []1.1 | []0.9 | []0.6 | []0.7 | []0.9 | |
| []-1.3 | []-0.5 | []-1.1 | []-0.7 | []0.7 | []1.1 | []1.2 | []0.7 | |
| []40.7 | []40.0 | []39.7 | []39.6 | []39.4 | []39.4 | []39.2 | []39.1 | |
| []21.9 | []21.8 | []21.2 | []21.5 | []21.2 | []22.1 | []21.6 | []21.7 | |
| []0.8 | []0.2 | []0.7 | []1.2 | []0.8 | []1.0 | []0.8 | []1.2 | |
| []1.4 | []1.4 | []1.2 | []1.3 | []1.2 | []1.0 | []1.2 | []1.2 | |
| []-0.3 | []-0.1 | []-2.1 | []2.8 | []-0.6 | []5.0 | []-1.3 | []1.6 |
Notes for users
Revisions and timetable
[]Compared with data released on 28 October 2025, the household saving rate for the second quarter of 2025 was revised slightly downwards from 15.5% to 15.4%. The household investment rate was left unrevised at 9.0%. The profit share of non-financial corporations for the second quarter of 2025 was left unrevised at 39.2%. Also the investment rate of non-financial corporations was left unrevised at 21.6%.
[]Around 94 days after each quarter ends, Eurostat publishes the first news release and a subset of quarterly key indicators on its website. Around 120 days after each quarter ends, Eurostat publishes the final release and detailed annual and quarterly sector accounts of Member States of the European Economic Area and derived key indicators, including annual indicators such as debt-to-income ratios. The final news release for the third quarter of 2025, focusing on data for household real income and consumption per capita for both the euro area and the EU, will be published on 28 January 2026.
Methods and definitions
[]The gross saving rate of households (household saving rate) is defined as gross saving divided by gross disposable income, with the latter including the change in the net equity of households in pension fund reserves. Gross saving is the part of the gross disposable income which is not spent as final consumption expenditure. Therefore, the saving rate increases when gross disposable income grows at a higher rate than final consumption expenditure.
[]The gross investment rate of households (household investment rate) is defined as gross fixed capital formation divided by gross disposable income, with the latter being adjusted for the change in the net equity of households in pension fund reserves. Household investment mainly consists of the purchase and renovation of dwellings.
[]The profit share of non-financial corporations is defined as gross operating surplus divided by gross value added. This profitability-type indicator shows the share of the value added that has been created during the production process remunerating capital. It is the complement of the share of wage costs (plus other taxes less other subsidies on production) in value added.
[]The gross investment rate of non-financial corporations is defined as gross fixed capital formation divided by gross value added. This ratio relates the investment of non-financial businesses in fixed assets (buildings, machinery etc.) to the value added that has been created during the production process.
[]The compilation of the European sector accounts follows the European System of Accounts 2010 (ESA 2010) and covers the period from the first quarter of 1999 onwards. The data come from a first release of seasonally adjusted quarterly European sector accounts released by Eurostat, the statistical office of the European Union and the European Central Bank (ECB).
[]Institutional sectors bring together economic units with broadly similar characteristics and behaviour, namely: households (including non-profit institutions serving households), non-financial corporations, financial corporations, government and the rest of the world. In the latter, to measure the external transactions of the euro area / the European Union (EU), it is necessary to remove cross-border flows within the area concerned.
Geographical information
[]Up to 31 December 2025, the euro area included Belgium, Germany, Estonia, Ireland, Greece, Spain, France, Croatia, Italy, Cyprus, Latvia, Lithuania, Luxembourg, Malta, the Netherlands, Austria, Portugal, Slovenia, Slovakia and Finland (EA20),plus the European Central Bank, the European Stability Mechanism and the European Financial Stability Facility. From 1 January 2026, the euro area also includes Bulgaria (EA21). The aggregate data series presented in this release still refer to EA20.
For more information
Share the release
[]Share component will be rendered here.
[]