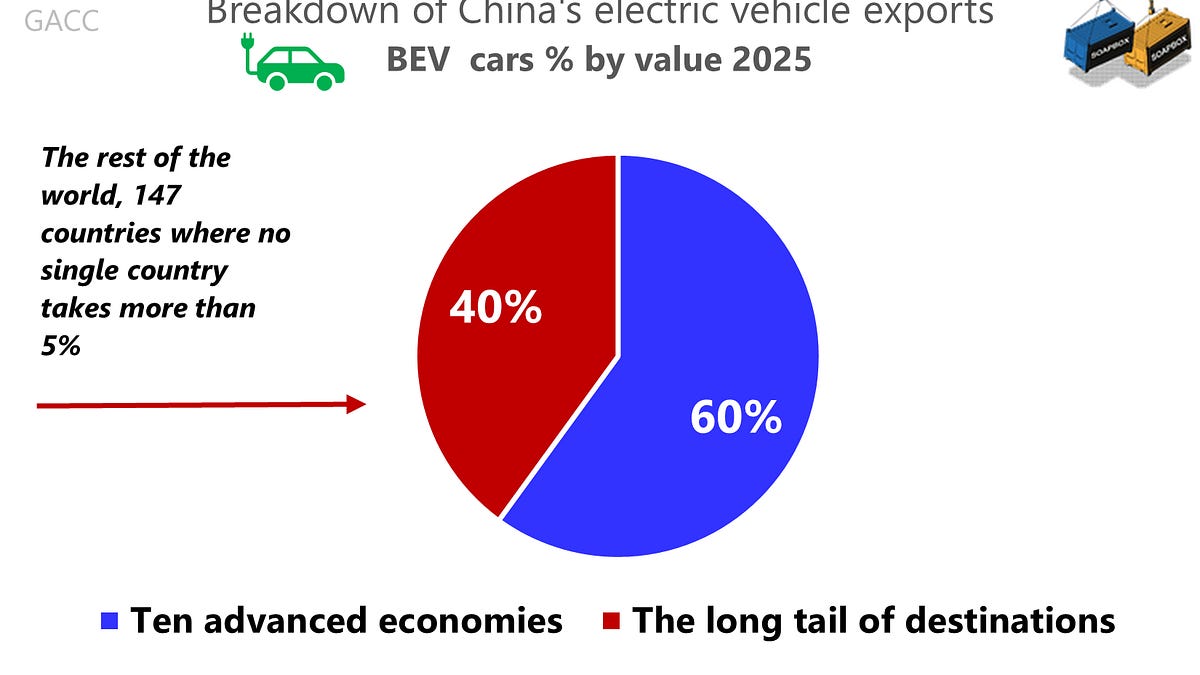

For this note, we split China’s BEV export destinations into two groups: ten advanced economies (about 60% of export value) and the long tail of destinations (the other 147 markets, together 40%, with no single market above 5%).
The 2025 headline number looks fine. China’s exports of pure electric cars rose 11% by value. But once we look at the split, the picture becomes more awkward.
The ten advanced economies still take the bulk of exports. The EU plus the UK alone account for 37%. Yet export growth into the advanced group is basically flat, up just 0.8% YoY. Almost all the momentum is coming from the long tail, up 30% YoY, but spread across many small bases.
That is diversification, in one sense. It also reads like a warning sign. A long tail can be wide in number and thin in purchasing power.

When 60% of the value base grows at roughly 1%, the remaining 40% has to do the heavy lifting to keep the total near +11%. If the “advanced” bucket stays around +0.8% in 2026, the “long tail” bucket needs to grow by roughly 26% by value just to keep overall growth in low double digits.
One year of that is plausible. Repeating it is harder, not because the world lacks countries, but because the world does not offer equal purchasing power, equal consumer finance, equal charging coverage, and equal service networks.
 Top five advanced-economy destinations for China’s BEVs in 2025
We are not dismissing the long tail. We are saying what the split implies. Many of these markets can absorb additional shipments, but often at lower average prices and in more price-sensitive segments. That matters because we are looking at the data by value, not by units.
A long tail can keep volumes rising while value growth starts to soften.
Now add a domestic force that should not be underestimated. China’s EV industry is crowded to the point of looking like a herd. Too many manufacturers are chasing share, and the dynamic often described as involution (neijuan) produces relentless pressure to cut prices and spend more just to stand still.
According to reports, policymakers and industry voices in China have urged companies to step back from price-war behaviour. But if domestic consumption is not exploding in a way that naturally absorbs output, the pressure to export does not ease. It intensifies.
 Top five long-tail destinations for China’s BEVs in 2025
This is where the export story can flip from “China is expanding” to “China is being pushed.” When dozens of firms try to grow overseas at the same time, they often collide in the same markets. That tends to push prices down. You can get headline-worthy shipment growth while value growth becomes harder to sustain. When we examine the data by value, that is not a nuance. It is the point.
There is also a demand-side headwind that is easy to underestimate. Across much of the world, consumers seem to be choosing a half step towards electrification. According to reports and registration data, hybrids remain the mainstream choice in many markets. People like electrification, but they also like not worrying about charging, not changing routines, and not betting on local infrastructure.
Even where BEVs are growing, hybrids and plug-ins often win the mass-market argument for now
 Top five destinations for China’s plug-in hybrid exports
If that preference holds, it creates an awkward mismatch for BEV-only export growth. Firms under pressure will go where demand is. If the market says “hybrid” rather than “pure BEV,” then the fastest commercial response is to ship more hybrids and plug-in models. According to reports, some Chinese brands are already leaning harder in that direction in Europe and elsewhere.
That is rational behaviour. But it can show up in the BEV-only export series as slowing momentum even if China’s broader auto exports remain strong.
So when we look at 2025, we do not just see a success story. We see a constraint forming.
Advanced markets are still where the value sits, and growth there is close to flat. The long tail is where the growth sits, and it is fragmented and price-sensitive. Meanwhile, the domestic herd dynamic pushes ever more supply outward, which risks turning growth into discounting. And consumers, in many places, appear to be telling carmakers that hybrids are the practical choice for the time being.
What we will watch in 2026 is not simply whether the long tail grows again, but whether it grows in a way that can carry value:
-
Does the long tail start concentrating, with a handful of markets becoming genuinely large rather than 147 small wins?
-
Does the average export price into the long tail hold up, or does competition turn growth into a price story?
-
Do hybrids and plug-ins reduce BEV demand at the margin, changing the export mix?
China can keep growing BEV exports. The question is the quality and repeatability of that growth. A strategy that spreads sales across many smaller markets can reduce single-country dependence. But it does not automatically create the purchasing power that replaces a flat, high-value core.
If the 2025 pattern persists, the pressure does not disappear. It compounds.
In 2025, China imported goods worth US$2.6 trillion. One detail is easy to miss: import growth was flat at 0%. In a year when the export story dominated headlines, that lack of momentum on the import side deserves more attention than it usually gets.
 2021 was a rebound year, then imports basically flatlined which helps frame why a bigger trade surplus can coexist with a lot of Global South rhetoric
Even so, the structure of China’s imports is fairly straightforward once you look past the detail. China Customs lists roughly 10,000 import codes, but the distribution is highly concentrated. Just 33 codes account for about 55% of the import bill, which means the bulk of China’s import demand is driven by a surprisingly small set of products.
Those 33 codes can be grouped into 10 sectors. And in most of them, the buyers are state-owned firms. That matters because it shows imports are not only a function of domestic demand, but also of procurement choices made by a relatively small number of powerful actors.
In practice, that can shape not just how much China imports, but what it imports and from whom.

Despite government efforts to reduce reliance on soybean imports, the volume imported in 2025 rose by 7%. Beef imports, by contrast, fell by 2%.

China’s appetite for mineral ores remained strong in 2025, led by copper.Copper ore imports by volume rose by 26%, while iron ore imports across grades were up around 9% and precious metal ores were broadly flat.

Since the invasion of Ukraine, Russia has become China’s largest supplier of crude oil, reshaping the import mix. At the same time, China stepped up crude inflows from Iran, largely via trans-shipment routes through Malaysia.

Continuing a long-standing trend, pharma import growth remained strong, with immunological products up 10% and medicaments up 7%.

China’s semiconductor import bill was 34% larger than its crude oil import bill. In 2025, boosted by AI-related demand, CPU imports rose by 24% in value.
The only consumer product with imports above US$10 billion fell by 2%, a far cry from the double-digit growth seen in the previous decade. It points to a rising share of made-in-China beauty brands, but also to a more subdued consumer mood.
Amid rising geopolitical tensions, China’s imports of machinery used to print semiconductor wafers fell by 2%, after several years of heavy buying. Goldtells a different story: higher prices pushed import value up 12%, even as import volumes dropped 32%. Copper waste imports also increased, but one line item moved the other way. Imports of copper cathodes, one of Iran’s hoped-for export channels into China, fell by 12% in volume.
On a more anecdotal note, we thought durian imports would finally break the US$10bn mark. A small moment of naivety: we forgot that China’s cut-throat price competition reaches even the fruit aisle. Import volumes rose 20%, yet import value was up only 7%. Imagine what that says about prices.

In our opinion the “Global South” story is real in direction, but not in scale. China’s surplus with EU+U.S.+UK is US$639bn, which is about twice the combined surplus with India + Africa + LatAm excluding Brazil.
The faster rise in China’s surpluses with Africa and Latin America fits a familiar pattern: China shipping more finished goods into these markets than it takes back. That can sit awkwardly with the solidarity narrative. A rising surplus is, in plain terms, China selling a lot more than it buys. Politically, that is manageable for a while. Then it starts to trigger “unbalanced relationship” debates, local industry complaints, and the first signs of procurement pushback.
India is a different case again. A US$116bn surplus, up US$14bn in a single year, is not just large. It is strategically charged. India is big enough to matter, close enough to be sensitive, and already inclined to manage its exposure to China. BRICS does not change that. If anything, India is likely to move sooner rather than later.
Finally, if the political message is “we can pivot away from rich markets”, the arithmetic tells a different story. Advanced economies still act as the main anchor for China’s export surplus. In other words, some of the current hard talk towards the EU or the U.S. looks performative. China can diversify at the margin, but it still needs those markets unless China is prepared to pay the price of not needing them.
That price would not arrive as a single dramatic shock. It would show up as slower growth, thinner profits, and more pressure on jobs in tradable sectors, while the state is forced to spend more to keep activity moving. It would also mean living with less access to the world’s highest-value consumers and toughest standards, and with a foreign policy that is louder but often less influential.
However, our hunch is China will not respond by softening course. It is more likely to double down. If that is right, the adjustment will not be quieter. It will be noisier, more friction, more retaliation talk, more policy drama, not less.
The lobby is urging the European Commission, the European Parliament and EU member states to stop pushing mandatory exclusion measures. Most of its members are Chinese state-owned firms.
Exports via Chinese cross-border e-commerce platforms to the U.S. fell 30% by value in 2025. When one big market raises barriers, the traffic rarely disappears. It diverts. TEMU, SHEIN, AliExpress and others shifted their focus towards Europe and the EU was flooded with 41% more platform exports by value.
The loss and the gain are almost symmetrical. Platform exports to the U.S. fell by roughly US$7bn, while exports to the EU rose by about US$8bn. Add the roughly US$1bn increase to the UK, and you have a near one-for-one offset. In plain terms, U.S. measures did not so much shrink the flow as redirect it.
One more point is worth noting. “Cheap China”, the affordable, small-ticket goods that these platforms specialise in, passed the US$100bn mark last year, up about 20% overall.
That growth was carried, above all, by the EU and the UK.
We are committed to sharing with you the best trade analysis we have to offer. If you would like to share something with us, feel free to comment in the section below or drop us a line at [email protected]
Share SOAPBOX
Like this:
Like Loading…
Разгледайте нашите предложения за Български трактори
Иберете от тук
Българо-китайска търговско-промишлена палата