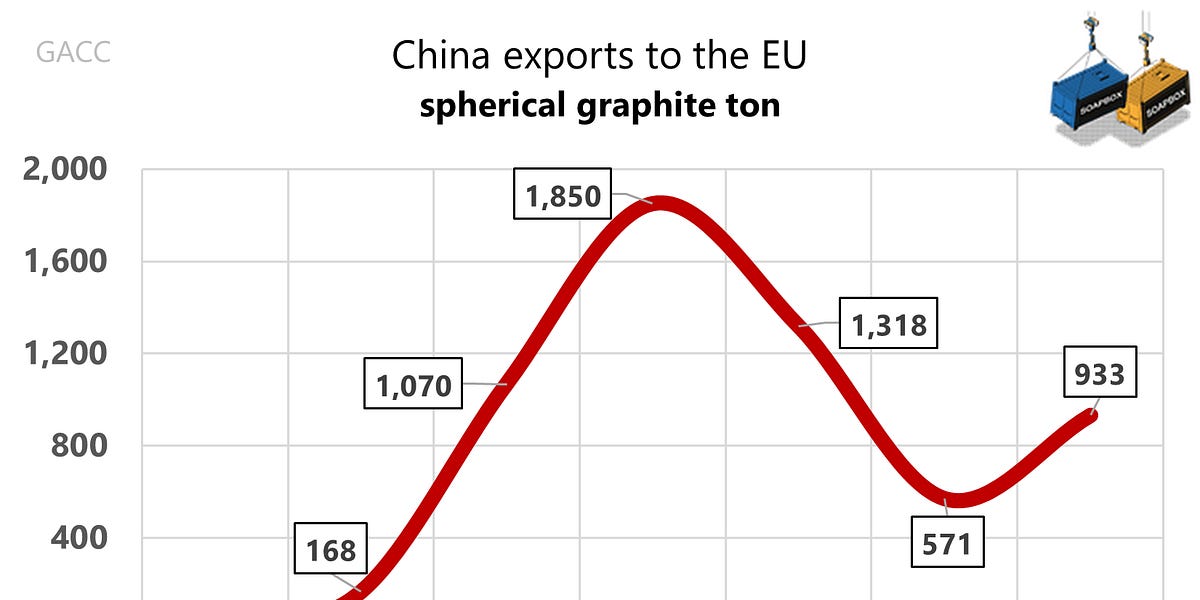

Reconciling China Customs data with EU trade statistics is difficult because the EU does not use a specific import code for spherical graphite, whereas China does. Two years have now passed since China imposed export controls on graphite.

Two years ago, China put export controls on several graphite products, including spherical graphite, a key ingredient in electric vehicle batteries. Yet if you look at customs data for 2025, the picture is more complicated. Between January and October 2025, China’s exports of spherical graphite increased by about 23% in volume, but only about 3% in value.
The export controls show that China can restrict flows if it chooses to do so. At the same time, overcapacity at home and low export prices abroad make it hard for the EU or the U.S. to launch new projects that would reduce dependence on China. Looking at customs data over the past seven years, China seems comfortable keeping average exports at around 54,000 tonnes per year.
This is not only about graphite. We have seen a similar pattern in rare earths.

China’s WTO disputes mostly involve the EU and US and tend to mirror each other when China is complainant and when it is respondent.

Import prices stay tame, but EU’s dilemmas do not.

For EU companies, a core problem is not just the controls themselves, but the lack of transparency and predictability in how they are applied. Forty percent report that the Ministry of Commerce’s approval process overshoots its own 45-day timeline; 39% say the process lacks transparency, 21% find application requirements unclear, and others highlight demands for extensive information, including on sensitive IP. There is also no effective appeal channel: 15% have faced problems due to the absence of an appeal process, and 12% say they were not told why applications were rejected.
The EU has dropped its WTO case after China lifted its informal curbs on Lithuanian goods, saying its key objectives were met. The chart shows clearly when Beijing’s imports from Lithuania were cut almost overnight. Still, from January to September 2025 Lithuania’s exports to China were about 30% below the same period in 2020.
Tellingly, even during the dispute China never stopped buying Lithuanian lasers, a field where Lithuania excels.
As far as we know, there was never a formal ban on imports from Lithuania. China did not need one. In line with its usual trade playbook, a quiet word in the ears of Chinese importers was enough for them to grasp the message. The same pattern can be seen in the current “spontaneous” cancellations of flights and trips to Japan.

China’s total imports in 2025 are set to edge down by just 1% YoY, but the composition shifts quite a lot. The five biggest declines alone shave an estimated USD 107 bn off the bill, led by mineral fuels (–69 bn) and cars (–21 bn), with cereals, cotton and wood also weaker. On the other side, import growth is narrowly concentrated: aircraft, nickel products, rubber, textile fibres and aluminium together add only about USD 16 bn. In other words, energy and traditional bulk suppliers face a tougher year, while a small group of higher-value industrial inputs still finds room to grow.

Five product categories alone account for almost 70% of total agrifood imports. The once-promising beverages and alcoholic drinks segment is now back at around its 2016 import level. Imagine.

If Jean-Baptiste Colbert or Friedrich List were alive, they’d study the China–Korea–Taiwan–Singapore–Vietnam–Malaysia–Russia cluster first when talking about mercantilism today


Two years ago, industry studies and Chinese official media were already converging on the view that between 2023 and 2027 mature nodes would still account for roughly 70 percent of global foundry capacity, with advanced processes stuck near 30 percent. Under tightening U.S., Japanese and European controls on advanced equipment, China’s effective investment focus shifted to legacy chips, 28nm and above. Several institutions expected the mainland’s share of global mature-node capacity to rise from about one-third to close to 40 percent by 2027.
Customs data so far this year are consistent with that pattern: in the first ten months of 2025, China’s integrated-circuit exports rose by 23.7 percent in value and 19.2 percent in volume year-on-year
China’s legacy chip dominance poses a quieter but real threat. These components may be less glamorous than advanced chips, but they are essential. The Nexperia crisis is a recent example. The company mainly makes cheap, mature-node discretes used in airbags, lighting and other basic systems, nothing high-end. After the Dutch government moved to seize the firm, China retaliated by blocking exports from Nexperia’s back-end facilities, and these seemingly mundane parts suddenly stopped flowing.


When pop stars go on tour they also export something: their country’s culture. In trade statistics, those earnings sit under exports of cultural services. For example, some estimates suggest that Taylor Swift’s Eras Tour generated around a one billion dollar export for the U.S.
Now Japanese singer Maki Otsuki has been pulled off the Shanghai stage mid-song, sending a different kind of message: China is open for business, right up to the moment someone in authority thinks better of it.
We are committed to sharing with you the best trade analysis we have to offer.
If you would like to share something with us, feel free to comment in the section below or drop us a line at [email protected]
Like this:
Like Loading…
Разгледайте нашите предложения за Български трактори
Иберете от тук
Българо-китайска търговско-промишлена палата