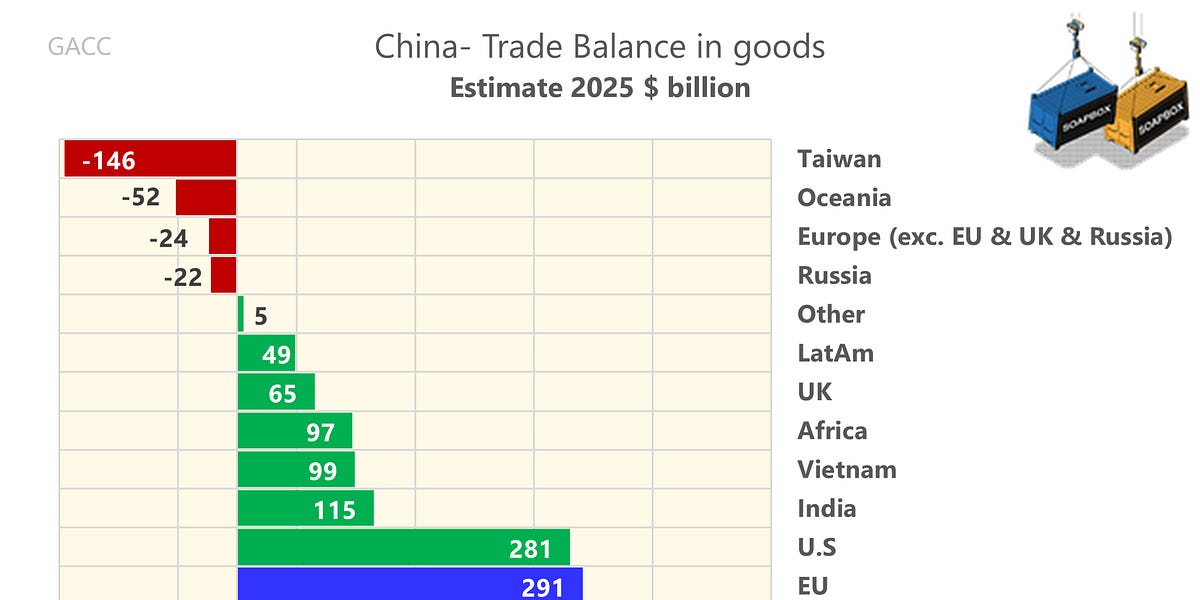

Geopolitically, goods imbalances are usually the ones that trigger action. That is why the chart below maps the fault lines so well.

In a classic mercantilist pattern, China runs large surpluses with demand-rich partners, runs deficits with suppliers of essential inputs, then uses those surpluses to secure more inputs and expand capacity at home. In effect, it exports adjustment costs to others, by pushing excess capacity abroad when domestic demand runs softer. When China’s growth model leans on external demand, weaker domestic absorption tends to show up as stronger exports. Partners feel it through factory closures, tighter margins, and job strains, even if consumers benefit from cheaper goods.
This surplus-led model is hard to sustain politically. Others notice. A goods surplus above a trillion dollars is not something you can disguise. And at roughly 1.2% of the rest of the world’s GDP, it is a scale comparison that is hard to ignore.
A system where a few regions carry very large deficits usually ends in retaliation. The chart almost sketches the next steps: more trade defences in the EU and U.S., and more pressure on Asian partners to localise supply chains. India is a striking case. It contributes about $115 billion to China’s surplus, close to one-fifth of China’s surplus with Asia excluding Taiwan.

Our take is that this stubbornness can weaken China’s position over time. A surplus-heavy model often delays rebalancing towards household consumption. It can leave China with an impressive manufacturing base, but also recurring external pushback and a rising risk of trade fragmentation.
At the same time, China has its own chokepoints, notably Taiwan’s technology inputs and Australian commodities. In a more hostile environment, China’s reliance on these inputs turns into a pressure point that others can exploit.
Russia is a useful reminder, too. China’s deficit with Russia is smaller than many would expect given the headline geopolitics. It still fits the “inputs” pattern, mostly energy and minerals, but the scale suggests the relationship is not built around balanced trade. It is primarily strategic alignment, with trade as one supporting channel.
The broader geopolitical weather points to more trade conflict in 2026, not less. The direction of travel is slow but steady: global trade splitting into blocs that overlap less and less with frequent flare-ups and temporary truces. It is not a clean break, and it is not a stable new equilibrium either. For the medium term, there is no settled diagnosis. There is only a more unsettled, contested system where supply chains, standards, and market access keep shifting, sometimes suddenly, and rarely for the last time.
China’s services exports have rebounded since Covid, but they still sit well below the US and the EU and, to a lesser extent, the UK in sheer scale. That gap looks partly structural. China’s export mix is still more exposed to travel and transport cycles and less concentrated in higher-margin areas. As a result, catching up in dollar terms is hard even when growth rates look respectable.

The recent recovery in travel to China could narrow the gap at the margin. But a meaningful closing would require sustained gains in the most scalable, high-value service segments, precisely the areas that tend to thrive on openness, cross-border data flows, predictable regulation and trusted institutions, where China’s political approach creates friction.
Our 2025 estimate is that China’s services exports, relative to each of the US, the EU and the UK, will be broadly unchanged from the 2020–2024 average. That is not good news for China, because that five-year baseline already includes a clear weak outlier in 2023.
China’s commerce ministry said it will impose provisional countervailing (anti-subsidy) duties of 21.9% to 42.7% on certain dairy products imported from the European Union, starting 23 December 2025. The move follows an anti-subsidy investigation launched in August 2024, and adds to the wider run of EU–China trade remedy disputes.
Expect a major push through July 2026.

The U.S. Trade Representative has concluded a Section 301 investigation and says China’s semiconductor policies are “actionable” because they burden U.S. commerce. As a response, the U.S. is creating a new tariff line covering a wide set of semiconductor-related products (including integrated circuits like processors, controllers, and memories), but it starts at 0%. The notice says this additional duty will increase on 23 June 2027, with the exact rate to be published at least 30 days beforehand.
This is less a “tariff hike today” and more a legal and administrative trigger. Phased implementation is common in trade actions (announce now, apply later). What is unusual is the optics of calling it a tariff action “now” while setting the new additional rate at 0%. In practice it is a “tariff switch” that is being installed today, then turned up later. The notice says the new duties are additional to an existing 50% Section 301 tariff on semiconductors from China. So, “0%” does not mean “no tariffs on chips”, it means “no extra tariff yet under this new action

Crude oil imports from Brazil rise 21%, up to 883 tousand bpd (barrels per day) from 729 thousand bpd in 2024

The EU’s price-cap ceiling on Russian seaborne crude oil is $47.6 per barrel. China has opposed EU measures targeting Russian crude, framing them as unilateral sanctions. At the same time, Beijing maintains close economic ties with Russia and treats its purchases of Russian crude as normal commercial cooperation.
The reality is that in 2025, these imports averaged about $68 per barrel. Since Russia’s invasion of Ukraine, Russia has risen to the top spot among China’s crude suppliers.
Chinese mainland imports from Taiwan rose by about one-third in 2021–2025 compared with 2016–2020. But the shipping story is far bigger than cross-strait trade alone. The Taiwan Strait is one of the world’s busiest sea lanes, with estimates of roughly 1,200 crossings a week. And traffic is not confined to the strait: vessel density is also high east of Taiwan along Pacific routes. In a blockade scenario, the risk would therefore spill well beyond the narrow waterway itself.

That matters because China’s export machine is tightly bound to seaborne trade. Energy imports and industrial inputs rely on predictable schedules, reliable ports, and insurable routes. Even a partial blockade, or a “quarantine” built around selective inspections and exclusion zones, could push up war-risk premiums, disrupt shipping rotations, and force costly rerouting, with knock-on effects far outside Taiwan.
The second-order effects would also come quickly. Financial spillovers would hit, and Taiwan-linked supply chains matter to China more than the headline semiconductor story suggests. Taiwan is deeply embedded in regional networks for electronics components and contract manufacturing. A sudden disruption there would ricochet into Chinese factories and exporters.

None of this means Beijing would never consider coercion at sea. Precisely because a blockade can be presented as pressure short of invasion, it may look “cheaper” militarily and more controllable politically, at least at the outset. The bet would be to squeeze Taiwan while managing escalation and limiting the coalition response.
The catch, from a trade standpoint, is that the corridor cuts both ways. The real question is endurance: who absorbs the shock longer, and how quickly disruption hardens into sanctions, investment retrenchment, and lasting supply-chain rewiring.
Our view is that a mainland blockade of Taiwan would likely impose serious costs on China and could prove a strategic blunder, especially if it is broad, prolonged, and triggers coordinated sanctions and a durable decoupling wave. But Chinese leaders might still attempt a more ambiguous, “blockade-like” campaign if they believe it can coerce Taiwan while keeping global blowback below the level that threatens China’s economic and political stability. We do not expect anything like that in 2026, but we have been wrong before. As noted above, there is no settled diagnosis for the medium term, still less over a twelve-month horizon.
Hong Kong largely serves as a trans-shipment hub for Chinese mainland exports. Those shipments to the EU are highly fragmented: no single product accounts for more than 7% of total value, with smartphones the largest category. This year’s increase is mainly driven by higher jewellery imports and a one-off German import of paintings over 100 years old shipped from Hong Kong. Since the paintings’ origin is the United States, this likely reflects either an auction sale in Hong Kong or the use of Hong Kong as an art-vault hub, with works stored there before being shipped to Germany. From 28 June 2025, the EU began applying a new regulation tightening controls on imports of cultural goods from non-EU countries.
China’s state media has rolled out a piece titled Nation’s steady foreign trade growth expected to anchor global stability that reads like cheap-talk reassurance: a blend of real trade figures and feel-good language casting China as an “anchor of global stability” in the face of Western protectionism.
It is strong on narrative yet thin on concrete concessions or costs, more image-crafting and cheap-talk leadership than policy, closer to economic virtue signalling than to a serious negotiating position.
By region, Africa accounts for 26% of these exports, led by Chinese projects in Algeria and Guinea. By country, Saudi Arabia (9%) and Russia (8%) top the list.

With our final 2025 newsletter, we want to thank you for reading and wish you a good close to the year and a strong start to 2026!
Subscribe for free to receive new posts and support our work!
We are committed to sharing with you the best trade analysis we have to offer. If you would like to share something with us, feel free to comment in the section below or drop us a line at [email protected]
Like this:
Like Loading…
Разгледайте нашите предложения за Български трактори
Иберете от тук
Българо-китайска търговско-промишлена палата